


Six ways to change log levels in production: an honest comparison

It’s 2 a.m. and you get a PagerDuty alert that something in production is misbehaving. Some requests are
slow, a queue is backing up, but the logs are at INFO. They’re logging everything except the details you need.
To figure out what’s going on, for most shops, the approach is to change the level to DEBUG and redeploy.
But a restart doesn’t just risk a disruption in service, it throws away the evidence:
the slowly leaking connection pool, the cache in a weird state, the retry storm that took an hour to build.
You redeploy, the symptoms clear, and now you find yourself in the awkward position of hoping things slow down
again because, if they don’t, you know you haven’t fixed anything. Meanwhile, you have to leave logging levels
set to DEBUG, which is now running up your Datadog bill, until the problem rears its head again.
So “change the log level without a restart” is a real problem, and it has real solutions — six of them, depending on how you count. In this article, we’ll take a look at every approach, provide code samples, explore the trade-offs, and wrap things up with our recommendations at the end.
Full disclosure, I build one of the hosted services near the end of this article: Smpl Logging. The approaches are ordered from “you may already have this” to “pay someone” so the right choice for you depends on your situation.
Approach 1: Your framework already has an endpoint
If you run Spring Boot, the whole problem is one HTTP call away.
Actuator ships a loggers endpoint:
GETto see every logger with its configured and effective level.POSTto change one on the running process.
curl -i -X POST http://localhost:8080/actuator/loggers/com.example.payments \
  -H 'Content-Type: application/json' \
  -d '{"configuredLevel":"debug"}'
To undo it, POST an empty object {} — the level clears and falls back to whatever your configuration says. That detail
matters at 2 a.m., because the second-most-common dynamic-logging incident is the DEBUG level somebody set during the
first one and never turned off.
But there are two catches:
- First, it isn’t on by default: Spring Boot exposes only
healthover HTTP, so you’ll addmanagement.endpoints.web.exposure.include=loggers— ideally on a separate management port. - Second, the auth story is exactly as good as you make it. An exposed actuator endpoint is unrestricted unless
Spring Security (or your own filter chain) says otherwise, and an
unrestricted loggers endpoint means anyone who can reach the port can set your root logger to
OFF. Spring’s docs tell you to put it behind security; do that.
Elsewhere on the JVM, this pattern is common.
- Micronaut has an equivalent
/loggersendpoint — disabled by default, and writes are refused until you explicitly allow them, which is the right default. - WildFly changes logger levels through its management CLI with no restart — its
management model explicitly marks the logger
levelattribute as requiring none. - Quarkus is the odd one out: log levels are “runtime” config only in the sense of settable
at startup without a rebuild; changing them mid-run takes a community Quarkiverse extension,
quarkus-logging-manager.
Off the JVM, the built-in endpoint mostly doesn’t exist. ASP.NET Core’s documented answer is configuration reload (next
section). Django, Flask, FastAPI, Rails, Express, Fastify, NestJS: no built-in runtime log-level endpoint in any of
them, per their current docs. Python’s standard library has a near-miss: logging.config.listen() starts a socket
server that accepts an entirely new logging config at runtime. Its own docs flag the catch: parts of the config are
passed to eval(), which means someone could run arbitrary code inside your process.
But these all change the log levels in just one process. And if you’re running behind a load balancer, you’ve enabled
DEBUG on whichever instance the load balancer decided to route the request to. To hit them all, you’ll need to
write an IP loop.
Approach 2: Watch a config file
The oldest trick in the book: the logging framework polls its own config file and reconfigures when it changes.
Log4j 2 calls it monitorInterval:
<Configuration monitorInterval="30">
    <Appenders>
        <Console name="Console">
            <PatternLayout pattern="%d %p %c{1} - %m%n"/>
        </Console>
    </Appenders>
    <Loggers>
        <Root level="info">
            <AppenderRef ref="Console"/>
        </Root>
    </Loggers>
</Configuration>
Every 30 seconds, Log4j checks the file for changes; edit it, wait, and the levels move — no restart.
Logback does the
same with <configuration scan="true" scanPeriod="30 seconds">. Leave scanPeriod off, and it defaults to one minute.
If you do set it, write the time unit explicitly, because a bare number means milliseconds. Logback will even fall back to the previous
configuration if your edit has an XML syntax error — a feature that tells you how often people hand-edit XML during
incidents.
.NET is the same idea with tighter plumbing. The default host builders load appsettings.json with
reloadOnChange: true, so editing Logging:LogLevel takes effect when the file is saved — triggered by a file watcher,
not a poll. This is the blessed mechanism: Microsoft’s docs
say plainly
that “the Logging API doesn’t include support for changing log levels while an app is running,” and offer config reload
as the answer.
Python’s stdlib, for the record, has no file-watching equivalent. You’d need to wire a watcher to
logging.config.dictConfig() yourself.
These approaches will, again, work fine for a single server but face the same challenges as before if you’re running lots of servers behind a load balancer.
The Kubernetes variant
If you’re using Kubernetes, you can mount the logging config from a ConfigMap volume and use that to change log levels
for all of your servers at once. Just run kubectl edit configmap logging-config and the kubelet refreshes the mounted
file on its sync loop: the framework’s watcher notices and every pod in the deployment moves to the new levels. No
restart, no rollout, and it works for any framework that can watch a file.
The fine print is latency and two footguns:
- ConfigMaps mounted via
subPathnever see updates. - ConfigMaps consumed as environment variables never update without a pod restart.
So if your levels don’t change, it’s one of those two.
As for latency, Kubernetes documents propagation as the kubelet sync period (default one minute) plus cache propagation delay; add the framework’s own scan interval on top, and a change can take a minute or two to reach every pod with the defaults above.
What you get in exchange for the wait: auth is your cluster’s RBAC, and if the ConfigMap lives in git behind a GitOps
flow, the audit trail is git log. What you don’t get: a console for making these changes with a click, or any
visibility into what the log levels are across servers and environments.
Approach 3: Do it yourself
Every logging framework has a programmatic setter — Python’s logging.getLogger(name).setLevel(...), pino’s
logger.level = 'debug', Go’s slog.LevelVar.Set(), and in Rails, Rails.logger.level = :debug (that setter is plain
Ruby Logger, not a Rails feature). So teams will eventually build an endpoint like this:
import logging
from flask import Flask, request

app = Flask(__name__)


@app.post("/admin/log-level")
def set_log_level():
    body = request.get_json()
    logging.getLogger(body["logger"]).setLevel(body["level"].upper())
    return {"ok": True}
Twenty minutes; it works on the first try and feels great. But it’s not a good long-term solution, starting with: how will you hit this API?
- If you make it public (which would be ill-advised), it needs authentication.
- If it’s behind a firewall, developers need VPN or some other mechanism to call it. And if that is the case, probably only certain developers get access to production.
And then there’s the whole “just one service” vs. “all services” issue, which puts you back to writing an IP loop.
None of this makes the DIY endpoint wrong. For a single-process internal tool, it’s the correct amount of engineering, and every one of the fancier options below is, at heart, this endpoint with the missing parts filled in.
Approach 4: Your cloud might do it for you
One cloud has built the real thing, for one runtime. Azure Container Apps has a dynamic logger-level feature for Java apps: enable the JVM diagnostics agent, and you can change a named logger’s level on a running app from the CLI:
az containerapp java logger set \
  --logger-name com.example.payments \
  --logger-level debug \
  --resource-group my-rg \
  --name my-app
No code change. No restart.
It supports Log4j 2, Logback, and jboss-logging. Changes take up to two minutes to land, and the docs still label the
feature a “preview.” One thing to know before the incident rather than during: enabling
the diagnostics agent itself may restart the app once. Auth and audit ride on Azure’s RBAC and activity log, like any
other az call.
AWS’s closest equivalent is Lambda’s advanced logging controls: set an application log level on the function configuration, and Lambda filters what reaches CloudWatch, no code change required:
aws lambda update-function-configuration \
  --function-name my-function \
  --logging-config LogFormat=JSON,ApplicationLogLevel=DEBUG
Caveats
- Your function must use JSON log format.
- A level set in code takes precedence over the setting — so this controls well-behaved functions and is ignored by stubborn ones.
- For containerized workloads (e.g. ECS, EKS, App Runner, Elastic Beanstalk), we could find no first-class equivalent; AWS’s own documented answer is AppConfig, whose docs name “logging levels” as a canonical dynamic-config use case. That’s the remote-config pattern, one section down, with you writing the glue.
Google Cloud has no first-class equivalent we could find for Cloud Run, GKE, or App Engine. The nearest thing is Firebase Remote Config’s server-side mode (Cloud Run, Cloud Functions, self-hosted; pull-based; still labeled a Preview release) — again the remote-config pattern, not a log-level feature.
Approach 5: Drive levels from a flag or config service
If you already run a feature-flag or remote-config service, you already own fleet-wide propagation, an auth model, an audit trail, and a targeting engine. The move is to point all of that at your loggers: store a levels map as a flag or config value, subscribe in-process, apply on change.
import logging


def apply_log_levels(levels: dict):
    for name, level in levels.items():
        logging.getLogger(name).setLevel(level)


# any flag/config SDK with an on-change hook works the same way
flags.subscribe("log-levels", apply_log_levels)
Change the value in the flag service’s dashboard, and every subscribed instance applies it within the SDK’s propagation window. Environment and service targeting come free, because your flag service already does that. Even per-request targeting is possible — but note the trick: logger levels are global state, so “DEBUG for this one customer” means evaluating a flag per log call (a logging filter that consults the evaluation context), not setting a level. It works, but you should tread carefully before deciding to evaluate a feature flag for every log message written.
This isn’t an exotic idea. LaunchDarkly’s own material pitches flag-driven log verbosity, and AWS documents it as a canonical AppConfig use case. But glue is the honest cost. The flag service doesn’t know what a logger is: its dashboard shows your levels map as a JSON blob, there’s no discovery (you type logger names by hand, and typo a namespace at least once), no notion of level inheritance, and loggers created after startup are yours to handle. It’s a fine pattern. You’re just building a small product on top of it.
Approach 6: Use a dynamic-logging service
Two products treat “change the log level of a running fleet” as the whole job rather than a side effect: Prefab — now Reforge Launch — and Smpl Logging. Both work the same way at the core: an SDK hooks into your logging framework, levels live server-side, and changes push to every connected process in seconds.
Prefab, now Reforge Launch
The pioneer here is Prefab, and its 2026 status needs a paragraph of its own. Prefab was acquired by Reforge and relaunched as “Reforge Launch,” with the authoritative docs now at docs.reforge.com. Meanwhile, prefab.cloud’s own homepage redirects to Quonfig — the Prefab founder’s new product — while the old Prefab pricing pages still stand.
The acquisition and reimagining notwithstanding, the capability is alive, carried forward, and sound. Level changes reach
running processes immediately over server-sent events, no restart. Based on the latest docs, frameworks supported include
Java (Logback, Log4j 2), Python (stdlib logging, structlog), Ruby (Semantic Logger, stdlib Logger, Rails),
Node (pino, winston), and Go (slog built in, with Zap and Zerolog modules). No support for .NET that we were able
to find.
Wiring is per-framework: add a filter to your handlers and wrap your logger.
Two things we could not verify from the docs:
- An audit trail for level changes.
- What the pricing will look like on the other side of the transition. The legacy Prefab tiers ($0 / $99 / $499 a month) are still published on the old site, but that’s all anyone can currently cite.
Smpl Logging
Smpl Logging treats the logger as the first-class object and instruments your runtime with one line of code:
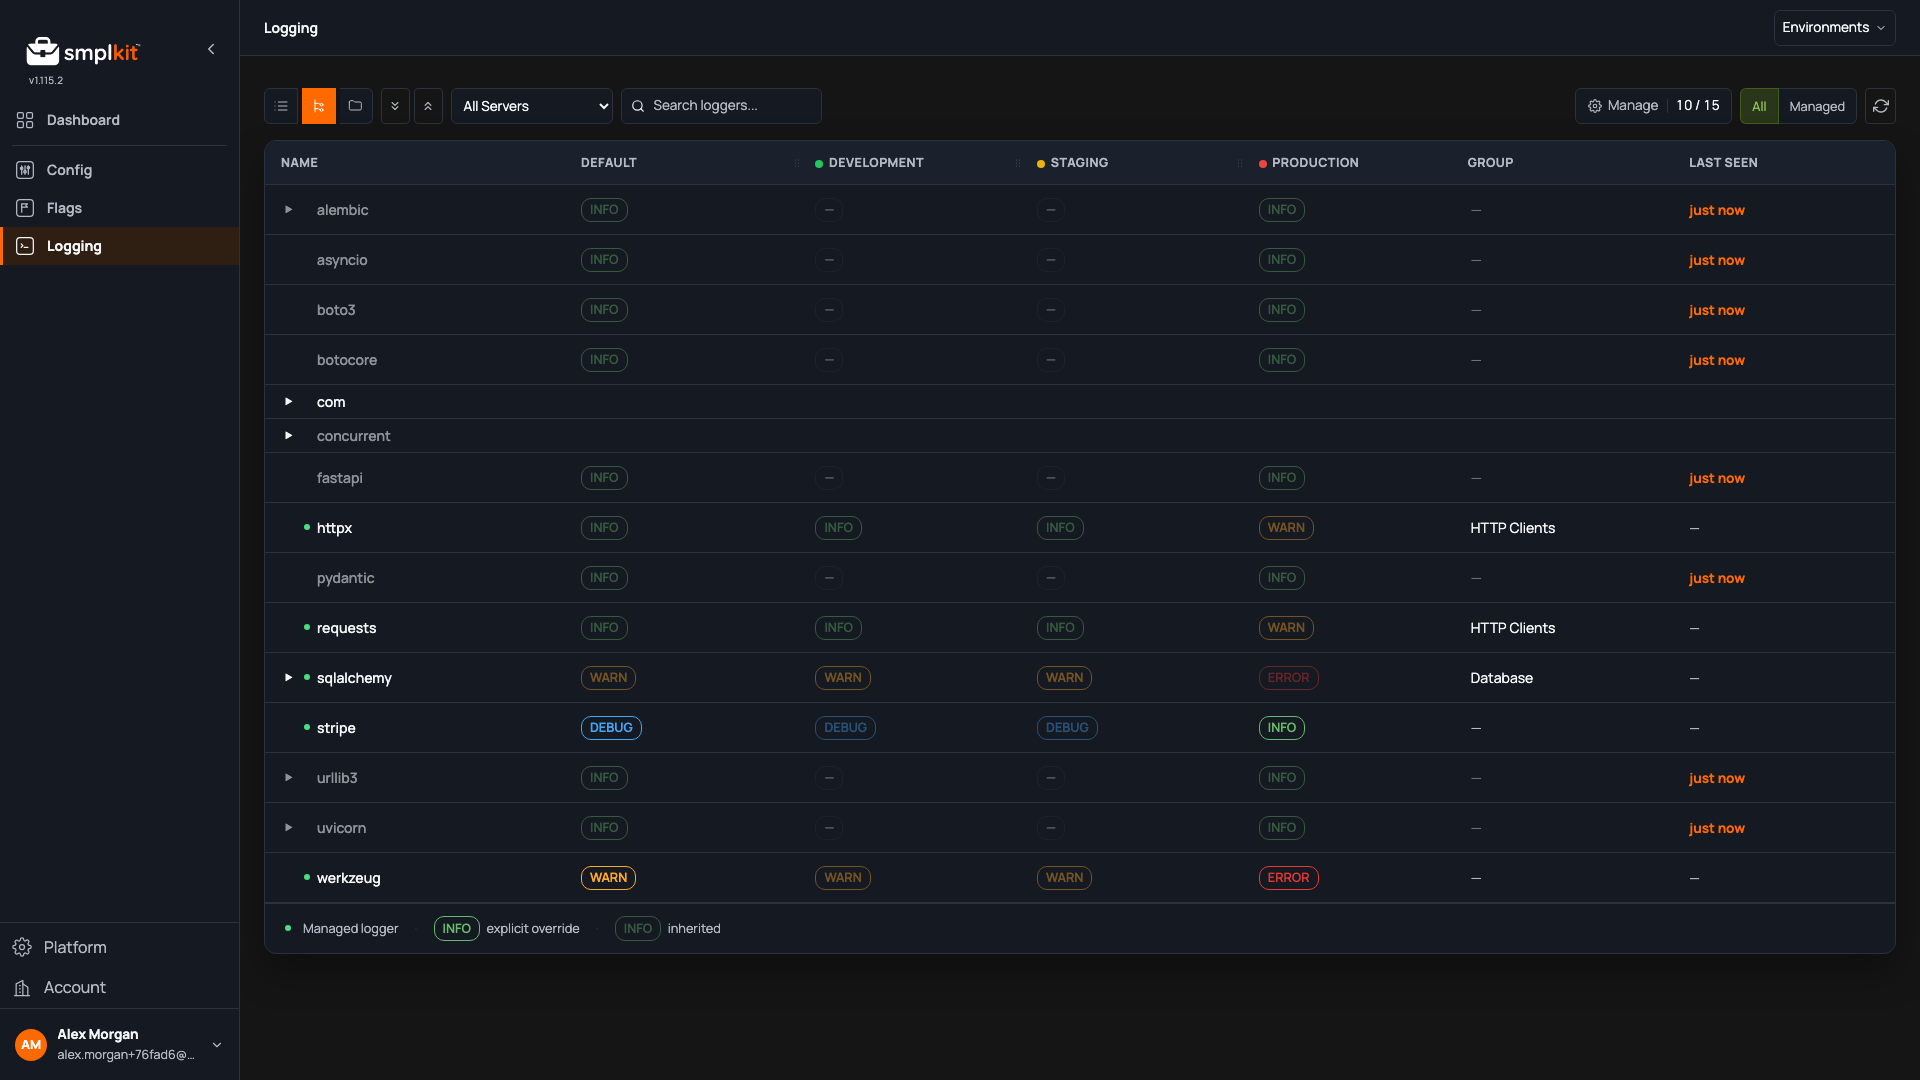
client.logging.install()Existing loggers are automatically discovered and registered with the platform. Changes made via the smplkit console (or via API or MCP Server) arrive over a WebSocket push in real time. Loggers created after startup — yours or some library’s — are auto-discovered too, so the console shows the logger tree your app actually has rather than the one you remembered to type in.
Frameworks supported include Python stdlib logging (auto-loaded; Loguru opt-in), TypeScript winston and pino,
Go slog and zap, Java Logback, Log4j 2, and JUL, .NET Microsoft.Extensions.Logging and Serilog, and Ruby stdlib
Logger and Semantic Logger. A pluggable interface is also included for anything not on the list.
Related loggers can be put into groups to make it easy to change them all at once, and role-based security can be used to limit which users are allowed to change log levels. Change history shows who changed what and when.
The free tier includes 10 managed loggers and 3 log groups with unlimited connected servers. Paid plans are all flat-rate ($49, $99, $249 by limits) with no per-server or per-request metering.
The comparison
Six approaches and five questions:
- Does one change reach the whole fleet?
- Do changes take effect immediately?
- Who’s allowed to make the change?
- Is there a record of it?
- Do you want a UI for making changes?
Here’s how they answer:
| Approach | Fleet-wide? | Immediate? | Auth story | Audit trail | UI |
|---|---|---|---|---|---|
| Framework endpoint | ✗ | ✓ | Yours to wire | ✗ | ✗ |
| Config-file watch | Per-process; fleet-wide via ConfigMap |
Scan- interval lag |
File perms; k8s RBAC |
git log (if GitOps) |
✗ |
| DIY endpoint | ✗ | ✓ | Yours to build | ✗ | ✗ |
| Cloud platform features |
Lambda & Azure Java only |
Up to 2 min on Azure |
✓ | ✓ | CLI-first |
| Flag/config-driven | ✓ | ✓ | ✓ | ✓ | A JSON blob |
| Reforge Launch | ✓ | ✓ | ✓ | Unverified | ✓ |
| Smpl Logging | ✓ | ✓ | ✓ | ✓ | ✓ |
The right row depends on what you’re running, so here’s the round-up, by situation.
If you’re using one Spring Boot service, or a handful you can address directly,
Actuator is probably your best bet. Expose loggers on the
management port, put security in front, and you’re done. The same verdict extends to Micronaut’s endpoint and
WildFly’s management CLI.
If you’re a Kubernetes shop with config discipline, use ConfigMap-mounted logging config plus the framework’s file watcher. It won’t take effect instantly. It can’t target anything smaller than a cluster, but it needs zero new vendors, zero new agents, and if your ConfigMaps flow through git, you get a better audit trail than some products sell.
If you’re all in on Lambda, or Java on Azure Container Apps, use the built-in platform feature. They’re purpose-built and governed by the IAM and audit machinery you already run.
If you’re already running a feature-flag service, and coarse control is enough, drive levels from the flag service. You inherit real-time propagation, auth, and audit for the price of some glue.
But for a polyglot fleet of microservices that needs speed, auth, an audit trail, and a UI console to make it easy, Smpl Logging checks all the boxes. Yes, this one is ours, but you can test-drive it yourself on our free tier, and it installs with just one line of code.
Related: The best cron job services for 2026, Which job schedulers fire on time? We tested ten., and The best audit log APIs for 2026.